
You have spent countless hours designing and testing your perfect chatbot. Each flow is finely tuned to help your users find their answers. Each question funnel is carefully crafted for maximum results of chatbot performance.
It is ready. You publish your chatbot and finally, your job is complete. Right? Wrong.
After you finally publish your chatbot and it’s out there in the wild interacting with your users, that’s when the real work starts.
Measuring exactly how well your questions are handled and how good each interaction is performing is essential for tuning each flow so that your results are maximized.
But how can we do it? And How can we check each and every user and create a global map of the best routes? How can we quickly realize which are the most difficult questions? How to pinpoint the flows where users are lost or get stuck?
We have been asking ourselves the very same questions on a daily basis and with our latest update, we’ve created something that can finally give an answer!
Xenioo Flow Statistics for chatbot performance
Xenioo Flow Statistics are a brand new feature (enabled by default on every account) that will automatically display usage statistics directly on your chatbot flow. With Xenioo Flow Statistics you have all of your user’s usage numbers clearly shown directly on your chatbot design and updated nearly real-time.
To understand how Xenioo Flow Statistics work, let’s build a simple chatbot. Have a look at the one below.
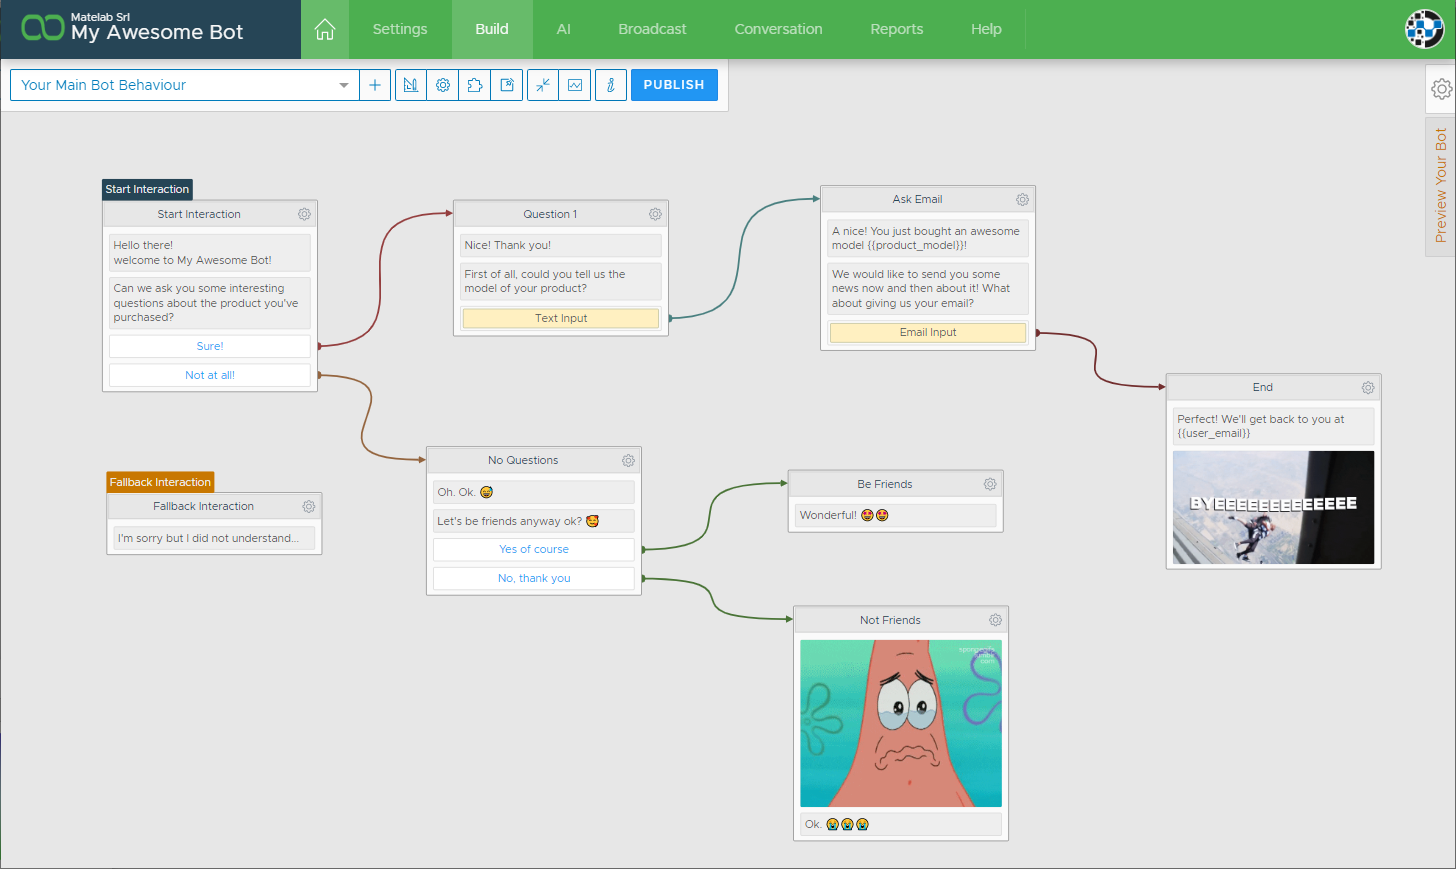
Our chatbot is doing a couple of things:
- Is asking our users to give a product model and later their email
- Is trying to stay in touch with users refusing to answer the previous questions
After publishing our chatbot it doesn’t seem to perform very well. We get very few people registering their product and we can’t really figure out why. We start checking each user conversation but as they grow in number it becomes pretty much impossible to track them all.
How can we verify our chatbot performance? Where are we loosing our users? Why aren’t they following our flow the way we want?
Cracking the numbers
In less than an hour after our chatbot goes live data starts coming in. Xenioo starts consolidating all your conversations data and giving it back to your chatbot flow.
Our design area starts to display our performance numbers right on the screen.
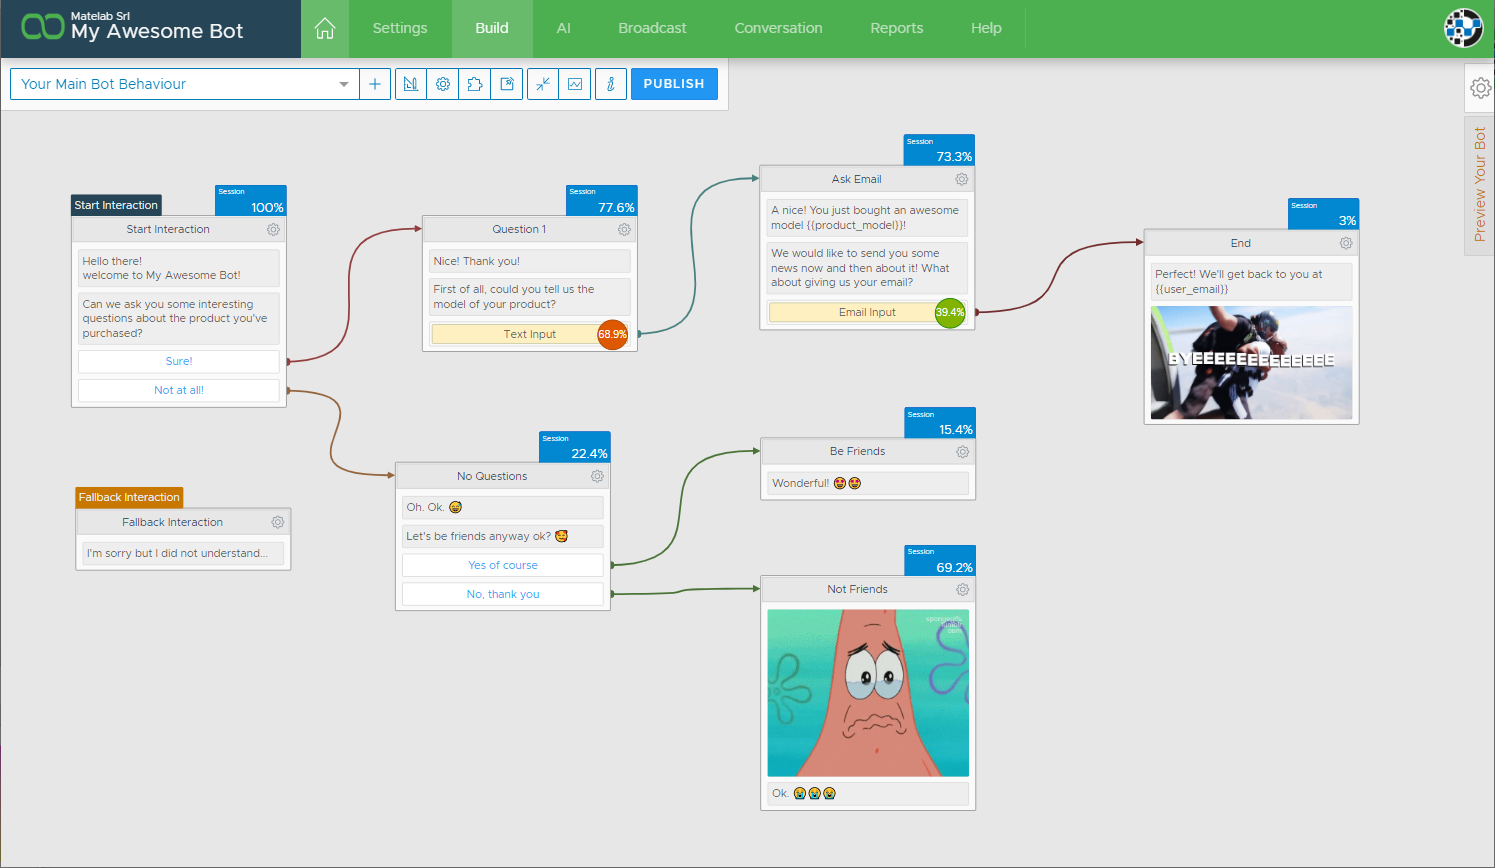
What we see on our flow above is exactly how our users are interacting with our chatbot. Our flow starts at the Start Interaction and there we’ve (obviously) 100% of our users. From there, Xenioo is displaying the percentage of people that moved from there to the following interaction.
So, reading the flow, we can see that 77.6% of our users chosen the Question 1 path while 22.4% opted for the No Questions one. Our aim is probably to collect as much information as possible and right now, we’re just loosing nearly a third of our potential contacts (and customers!).
For our test, let’s try to change around our start interaction to give our users a hint about something good happening if they participate in our survey. We publish again our chatbot come back the next day.
Daily Updates
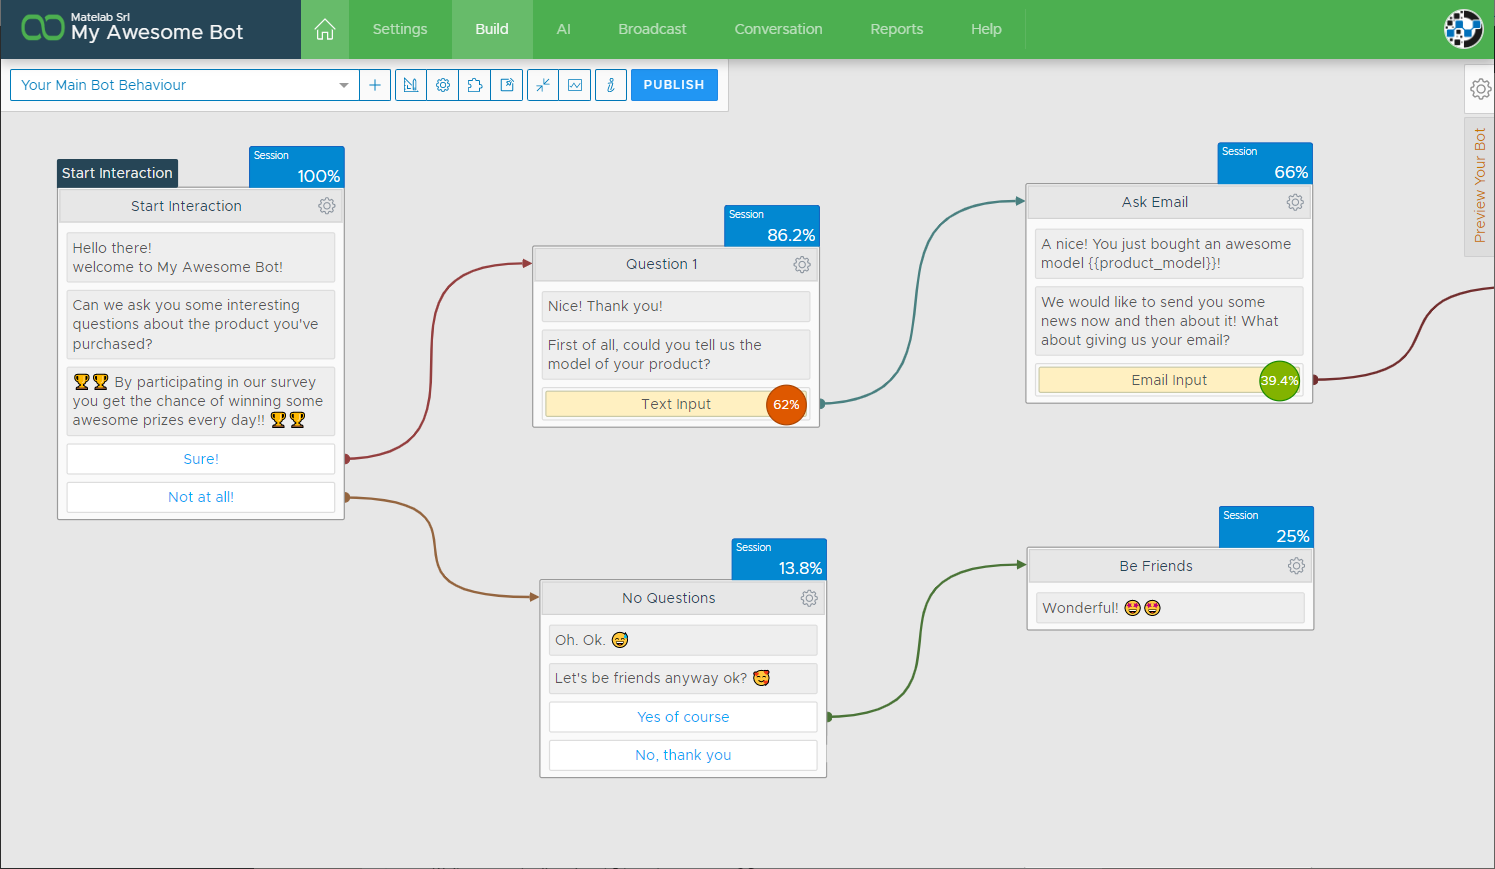
It’s getting better! Now just about 13% of our users are not choosing to participate in our little test survey.
But we can do more with this data: let’s click on the Show Statistics button on our top toolbar to display all of the Xenioo Flow Statistics settings.
Xenioo Flow Statistics are consolidated daily and each day of your chatbot life is available and will stay as long as your retention allows. On the Date Range of our settings, let’s ask to display only the latest day, the one right after our flow update and then click Refresh.
Awesome! Checking only the latest day, we see that with our changes we’re actually reaching nearly 95% of our potential customers. A lot better than before. We can now move on to the rest of our flow.
Input Statistics
Activating Xenioo Flow Statistics, you can now see a small badge beside our Text Input action saying 56.4%. This is telling us that more than half of users fail to correctly input the expected text in that question.
How can Xenioo help us improve the performance of this question? Let’s click on the action.
Looking at the action details you will immediately notice an additional space where the percentage is repeated with a little more information. Near the short explanatory text, you may find a “Show Samples” link. Click on that link and Xenioo will automatically display a list of the 10 most recent wrong answers given to the question!
Now we know which is the input that stops our users. We can use NLP to help them out with their questions or give better explanation of which information we’re requesting.
Remember all the data is consolidated so if you’re looking at multiple days you’ll see the most recent inputs of all the filtered days!
Go with the Xenioo Flow for chatbot performance
By default, Xenioo Flow Statistics will display relative interaction values. This means that the percentage displayed on an interaction will be relative to the number of users of the previous one.

If you look at the percentages above what Xenioo is actually telling you is that of 100% of users visiting the bot, only 86.2% reach the Question 1 interaction. Of all the Question 1 users, only 66% reach the Ask Email.
The same way, as 13.8% of users choose not to reply, only 25% of those choose the Be Friends path.
Xenioo Flow Statistics also support absolute mode. Selecting the option from the Statistics Settings menu will automatically switch your view to display each percentage as an absolute value related to your start interaction.
While using the absolute mode, each interaction percentage is calculated in relation to the number of users that reached the start interaction and not to the number of users coming from the calling one.
Take Control
Phew! We have just learned a lot of new things today! We are looking forward to seeing how this new tool will help you take control of your chatbot performance.
What do you think? Is this the tool you’ve been dreaming about? Let us know by joining our Facebook group or by contacting us directly: we’re looking forward to your feedback!